Analysis Examples
The Concepts at the Core of AppO’s Analysis
To understand the following analysis examples you will need to understand the concept of “Relative Business Value”.
If you are familiar with the concept of Relative Business Value please select from the menu at the right:
The Concept of Relative Business Value
Business decisions are about choosing the most beneficial solution (Plan A) but should always have rational alternatives (Plans B,C,D, etc.).
To gauge the potential performance or suitability of any investment option (option, project, program, portfolio) AppO analysis produces a number between minus 5000.0000 and plus 5000.0000, that represents the relative value of the option to the business when considering the framework of value measures and calculated from an opinion of importance and an opinion of likely outcome of the investment. This number is called the Relative Business Value or RBV. RBV as produced by AppO is statistically defendable meaning that when two RBV values are compared the larger is the “most valuable” alternative.
A positive RBV is a benefit to the business, it will add to the overall value of the business. A negative RBV is a dis-benefit to the business and will reduce the overall value of the business.
It does not matter what value measure framework is used to determine Relative Business Value, the relativity of the number will hold so that options considered using differing value measure frameworks (as would occur when considering investments in differing markets or countries) can be compared – The higher the number, the greater potential contribution to value generation for the business.
How can we prove to our staff and ratings organisations that our reporting on sustainability is transparent?
If you use AppO your value measures and the importance ascribed to each in making a decision will be visible to your staff. You could consider disclosing them to other stakeholders in some abridged form as public relations.
Simply by using AppO your processes for making decisions can also be transparent to whatever stakeholders you choose, thus proving the substantiality and rationality of your measures, opinions, processes and decision outcomes.
What does RBV Measure?
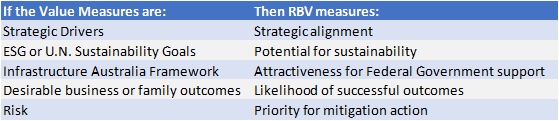
The simple answer is that what RBV measures depends on what you want it to measure. Please look at the following table for a few examples:
Analysis Examples – Value for Money
AppO plots value for money as how much of a single value measure (criterion) or group of value measures (group of criteria) is delivered relative to financial cost and benefit.
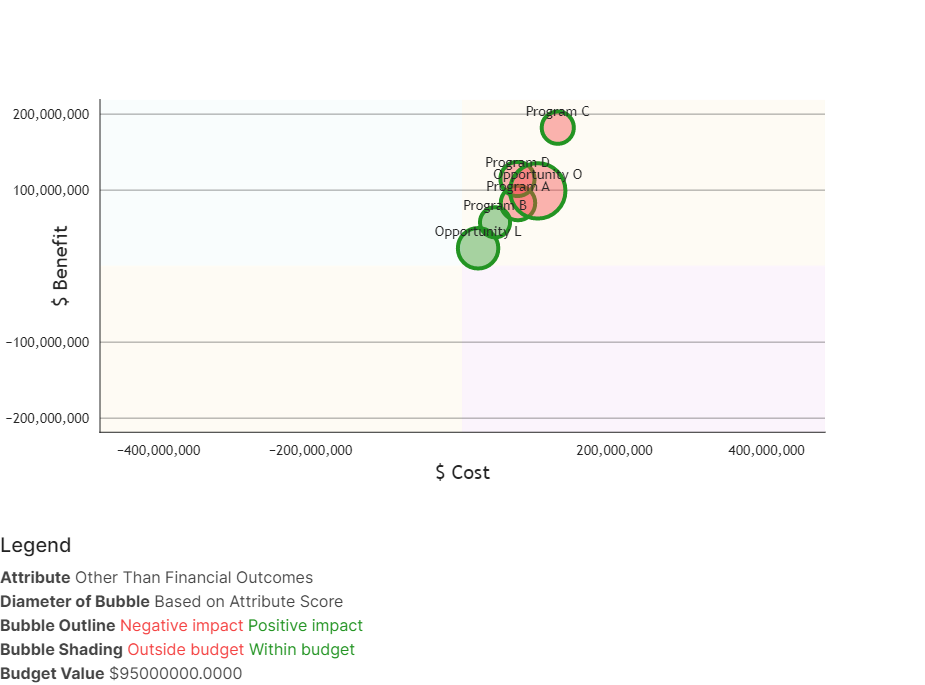
In the above analysis six investment alternatives have been submitted, 2 opportunities and 4 programs.
The analysis is focussed on a group of value measures described as “Other Than Financial Outcomes”, which is a positive impact value measure – Look at the colour of the outline of the bubble (Green is positive impact, Red is negative impact).
Opportunity O delivers the majority of “Other Than Financial Outcomes” and Opportunity L delivers the next greatest amount – Look for the size of the bubble to determine how much is delivered.
Because of the low overall Relative Business Value (RBV) of Opportunity O and limited capital allocation ($95 Million) it is unlikely Opportunity O will be executed within this allocation – Look at the colour of the bubble shading (Green is likely to be funded, Red is unlikely to be funded).
Without Opportunity O “Other than Financial Outcomes” may be at risk. Perhaps we need to look at how the overall RBV of Opportunity L can be increased or how capital allocation could be increased to more than $95 Million to accommodate Opportunity O.
Stakeholder Consensus
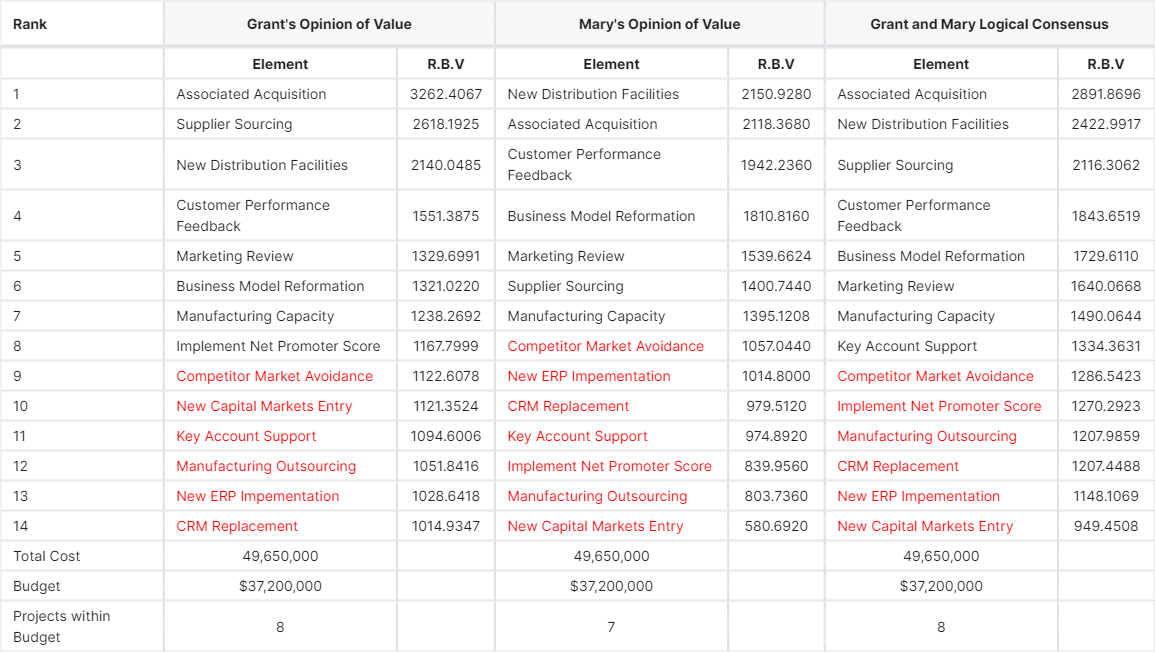
This is a ranked analysis of a small portfolio of business transformation projects showing the projects that could be achieved within the available budgetary allocation.
The opinions of importance for the criteria hierarchy are those of the organisations immediate past CEO (Grant) and the new CEO (Mary) and was derived at the request of the new CEO, who also requested that the automatically generated logical consensus opinion of importance also be included in the analysis.
While this is an overview analysis, it is used to engender discussion of the total impact on the recommended portfolio of one opinion relative to another. You can see that:
- 8 projects could be executed based on the opinion of the past CEO; and
- 7 projects could be executed based on the opinion of the current CEO; and
- 8 projects could be executed using the logical consensus position.
Please note that although the number of projects is the same under the old CEO and the consensus position the sequence in which they should be executed has changed.
You might also note the sharply lower RBV values generated from the current CEO’s opinion which means that, overall, she considers the portfolio to be less strategically aligned than did her predecessor.
The most striking variations in prioritisation occur for the projects entitled “Supplier Sourcing”, “New ERP Implementation”, and “New Capital Markets”, which could possibly start a conversation about changes in direction under the new CEO.
Because of its low RBV it is unlikely that “New Capital Markets” will be funded in this accounting period. Due to the nature of new initiatives with larger RBVs being developed or discovered and introduced to the portfolio as time progresses (and considering AppO can revise RBV based on market and initiative fluctuations) it is entirely possible that “New Capital Markets” may never be funded despite it conforming to the organisations investment policies.
Maintenance strategy spending alignment
- Is the spending on our portfolio balanced?
- Are we spending too much on some strategic drivers and not enough on others?
- Where should we look in our portfolio for strategy delivery, operational and project cost savings?
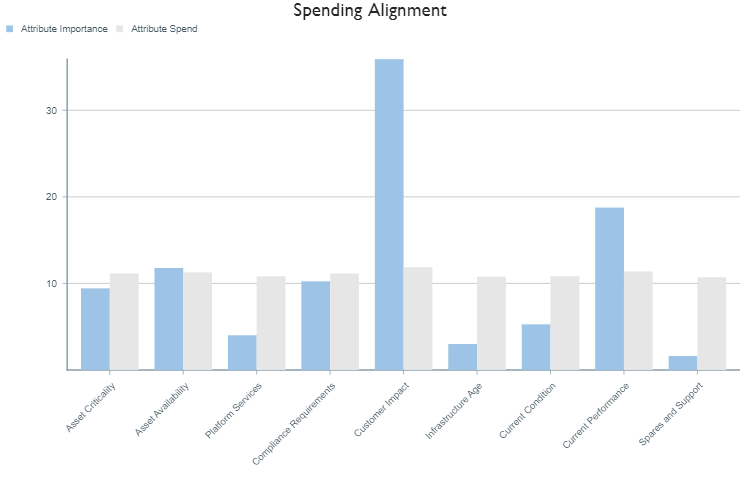
This analysis, taken from an asset maintenance portfolio, shows the proportion of cost being spent on the portfolio (or sub-portfolio) against each criteria (value measure). That proportion is being compared to the opinion of importance for each value measure. In a balanced portfolio the amount spent should approximately equate to the importance of gaining that value.
In this example our spending is not sufficiently sensitive to Customer impact (35% important and only 11% of budget), Current performance (18% important, 11% of budget) and Asset availability (12% important, 11% of budget). It also shows that we are spending too much on all the others.
We clearly need to look at the disparity of spending on customer impact and possibly should consider introducing customer opinions into our analyses to understand the specific drivers and how our approach will be perceived.
We should also look at the initiatives that contribute to the overspent value measures to understand possible cost savings and identify the areas that might drive internal (or vendor negotiations for) efficiency gains.
Transformation spending alignment?
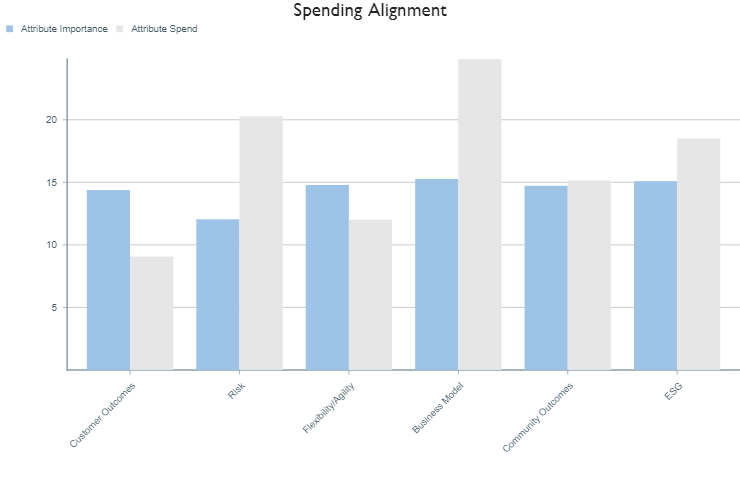
Here we have the same analysis but against a business transformation portfolio. During this analysis it was identified that there were specific desirable community outcomes described as ESG, thus there is a focus on community outcomes in addition to those defined as ESG.
This portfolio is unbalanced because the cost of delivering the Business Model, Risk, ESG and Community Outcome values are in excess of their importance while the amount spent on other value measures are less than their importance and may be in danger of being achieved.
Quick decisions – The Prioritisation Card
We need to choose between two investments? What should we choose?
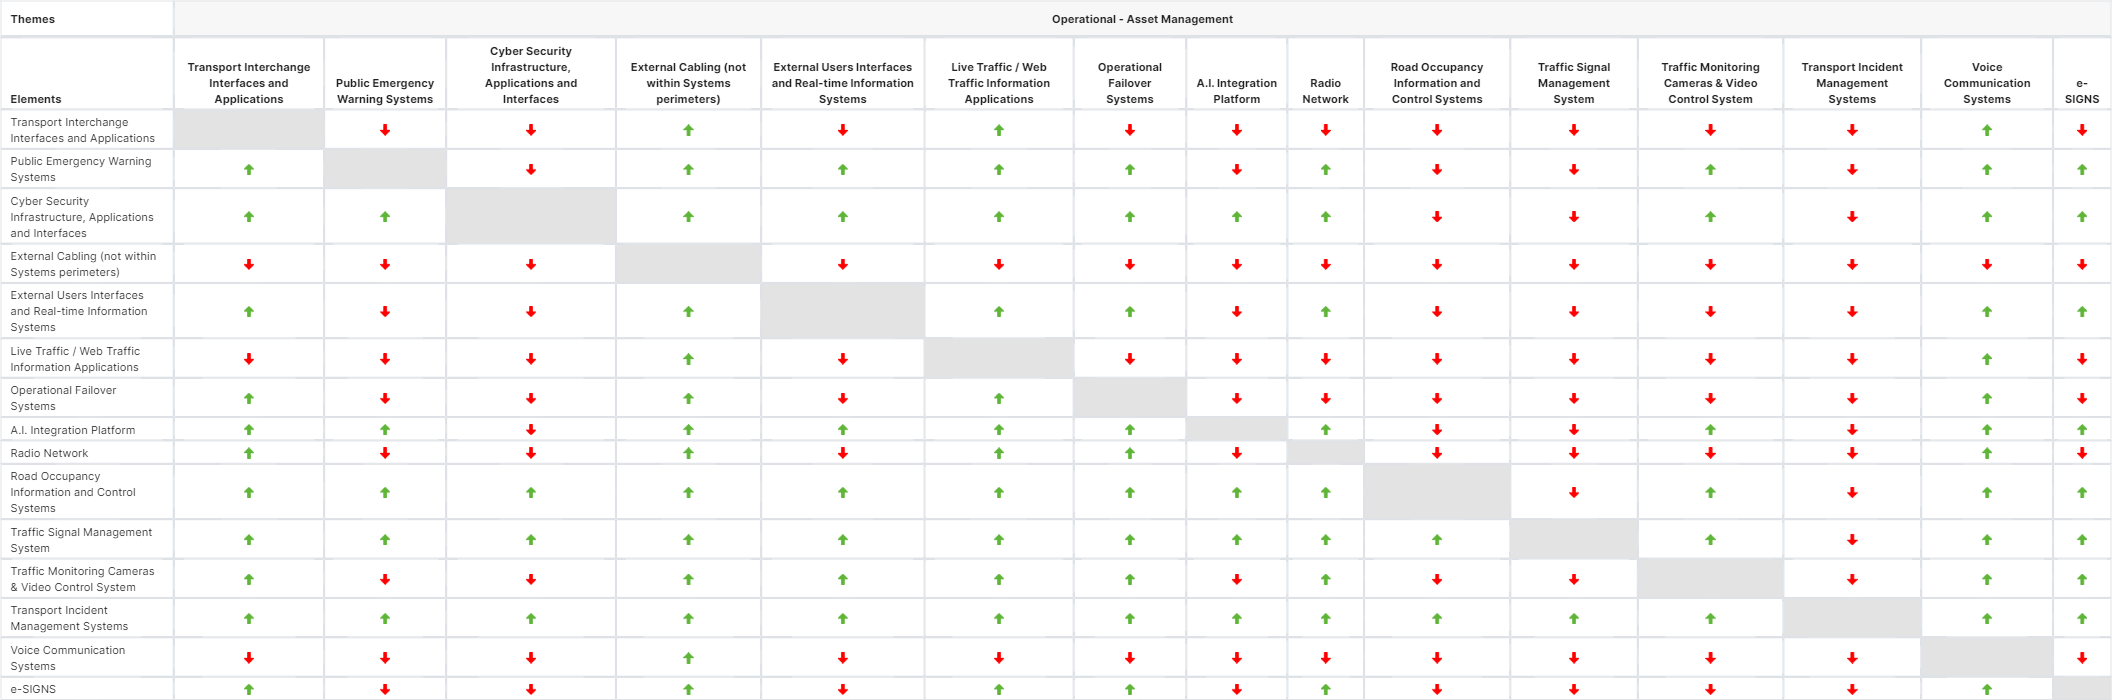
This analysis shows the portfolio (or sub-portfolio) of assets that has been analysed for risk and indicates which is the most valuable for each pair of assets. The asset investments are listed across the top and at the side. When comparing two investments find the first on the left and the second at the top and where those rows and columns intersect is a red, green, or amber arrow. If the investment at the left is most valuable the arrow will be green, if it is the least valuable it will be red and if they are of equal value it will be amber (very, very rare).
Among obvious other uses a simple card of this nature can guide field staff in making cost and risk efficient decisions.
Strengthening weak proposals
In a group of options, which is weak, which is strong?
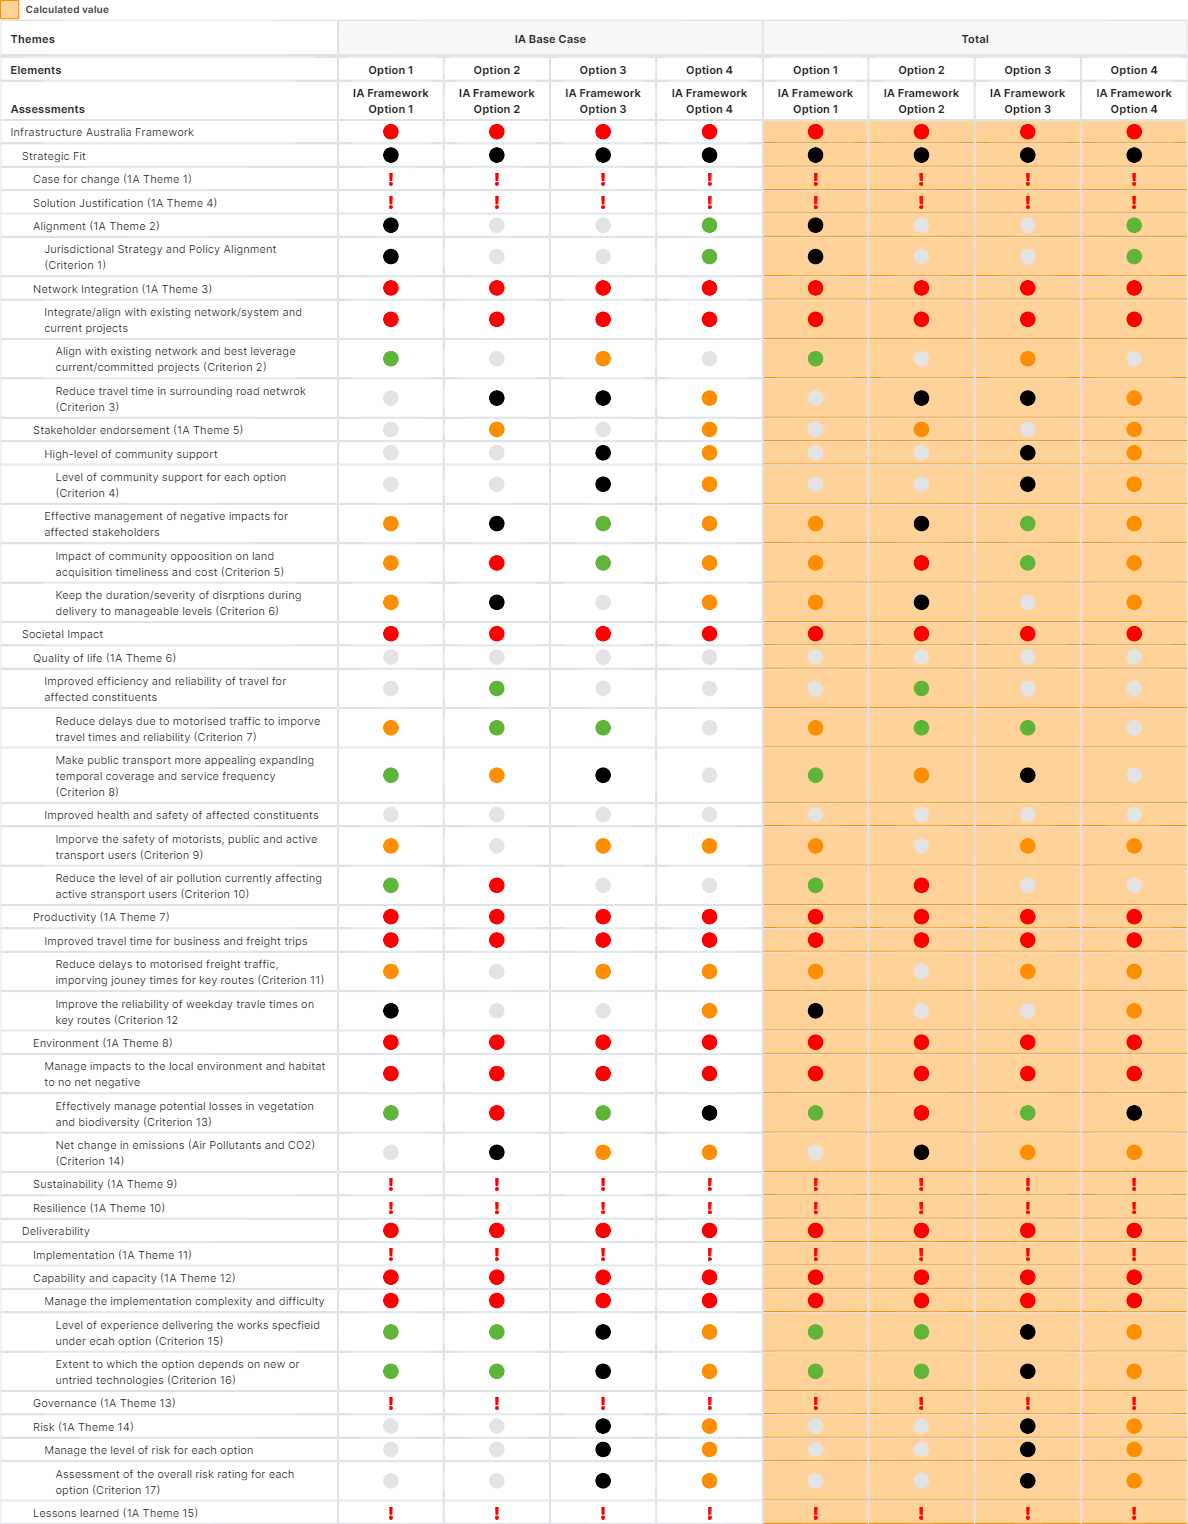
This analysis is against the Infrastructure Australia Framework and is designed to provide a visual impression of strength and weakness. In this analysis:
RED = Not recommended,
Black = Needs Improvement,
Orange = Caution is recommended,
Grey = Supported,
Green = Recommended,
Red “!” = no data input
This analysis would suggest option 4 is the strongest and option 2 is the weakest but the main take-out is where each option can find additional value compared to other options and gives indications of where integration of characteristics might generate additional value in any option. For example, if the Jurisdictional Strategy and Policy Alignment (Criterion 1) from Option 4 to other options it would strengthen the rationale for the other options.
Where is the business value coming from?
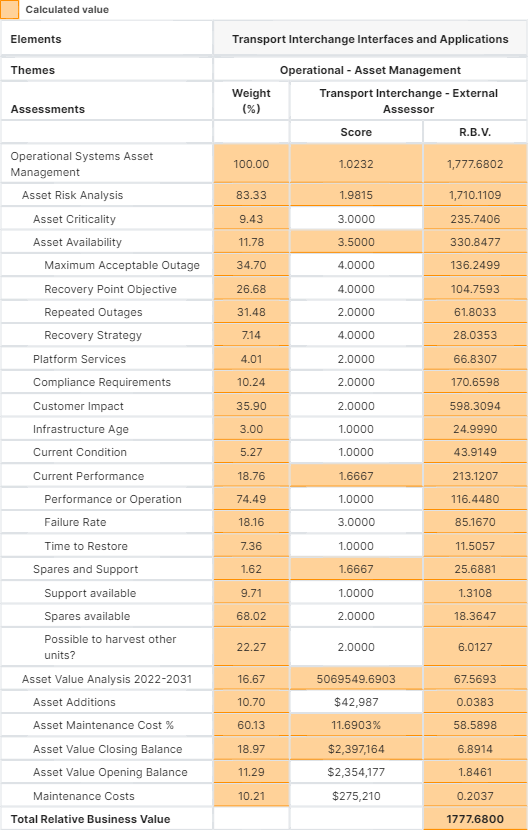
This analysis is an example where we are looking at the risk of failure of groups of assets in an asset maintenance portfolio and inspects only one candidate for investment.
The orange fields are automatically calculated by AppO. The white values are input from an assessment of performance or suitability.
Your can see that the RBV of child criteria (those indented from those directly above) sum to the parent value. By looking at this example you can see the contribution of any criteria to the total RBV for this potential investment e.g. Spares availability adds 18.3647 to the total RBV of 1,777.6802, which is a very small portion of the total RBV.
The greatest contribution to the total RBV is “Customer impact” even though the opinion of suitability is generally low (scores a 2 out of 5). Under normal conditions 35.90% of the total cost of this initiative (The importance of customer impact) should be spent on customer impact but in this case (all things being equal) we are only spending 33.66% (1777.6802 / 598.3804).
This means that you can instantly identify where the investment could be improved and where the investment is sensitive to a particular criteria.
Where do we need to compromise?
How do these opinions affect the potential value of this investment?
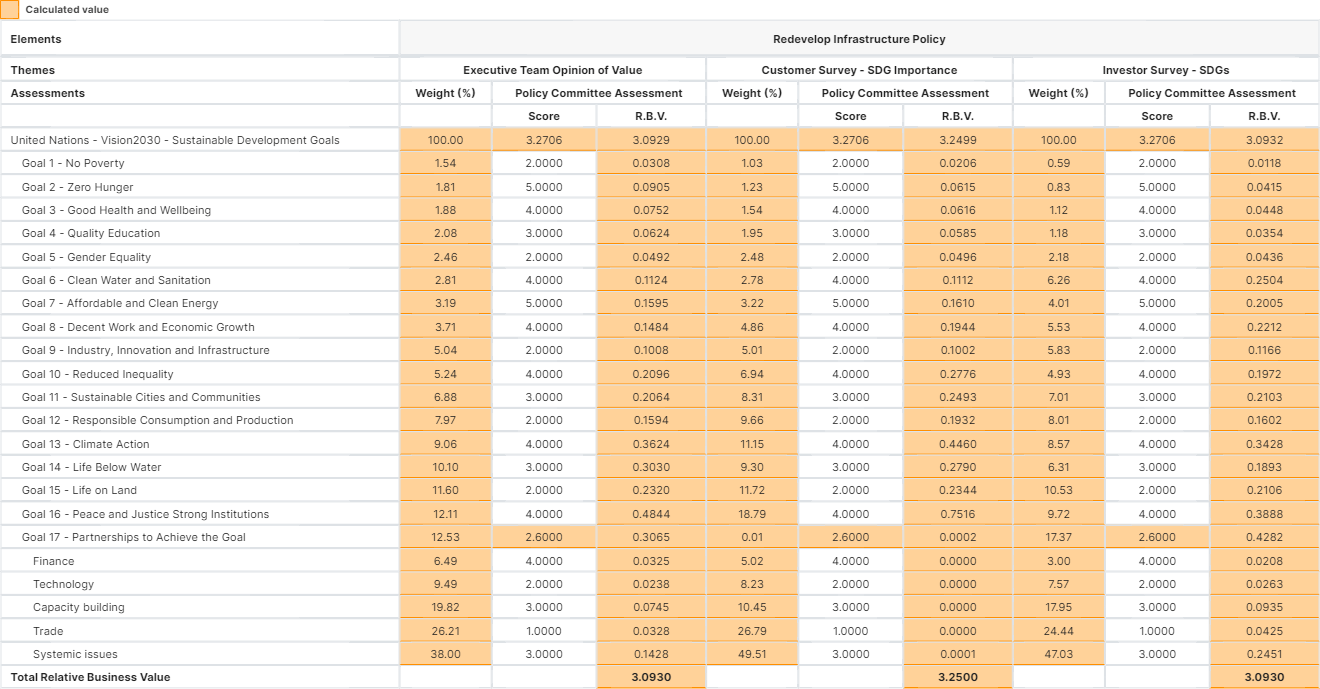
This analysis comes from assessing an option to redevelop infrastructure policy against the United Nations Vision 2030 Sustainable Development Goals. It shows three opinions of importance; the opinion of the executive team, an opinion derived from a customer survey, and an opinion derived from an investor survey. It uses only one opinion of suitability or outcome against all three opinions of importance.
This type of analysis allows you to compare the relative value that would be derived for each stakeholder group, thus, in this example the proposal would be of marginally greater value to the customers than the executive and the investors who would benefit the same in toto albeit differently in detail (which highlights potential negotiating/sticking points).
In summary, this analysis shows the impacts of the opinions of importance in detail and highlights the areas that could be candidates for improvement to lift the outcomes of importance to each stakeholder group.
Note that AppO can compare any number of investment options relative to any number of opinions of importance and also any number of opinions of suitability or outcome.
Comparing $ cost to sustainability outcomes
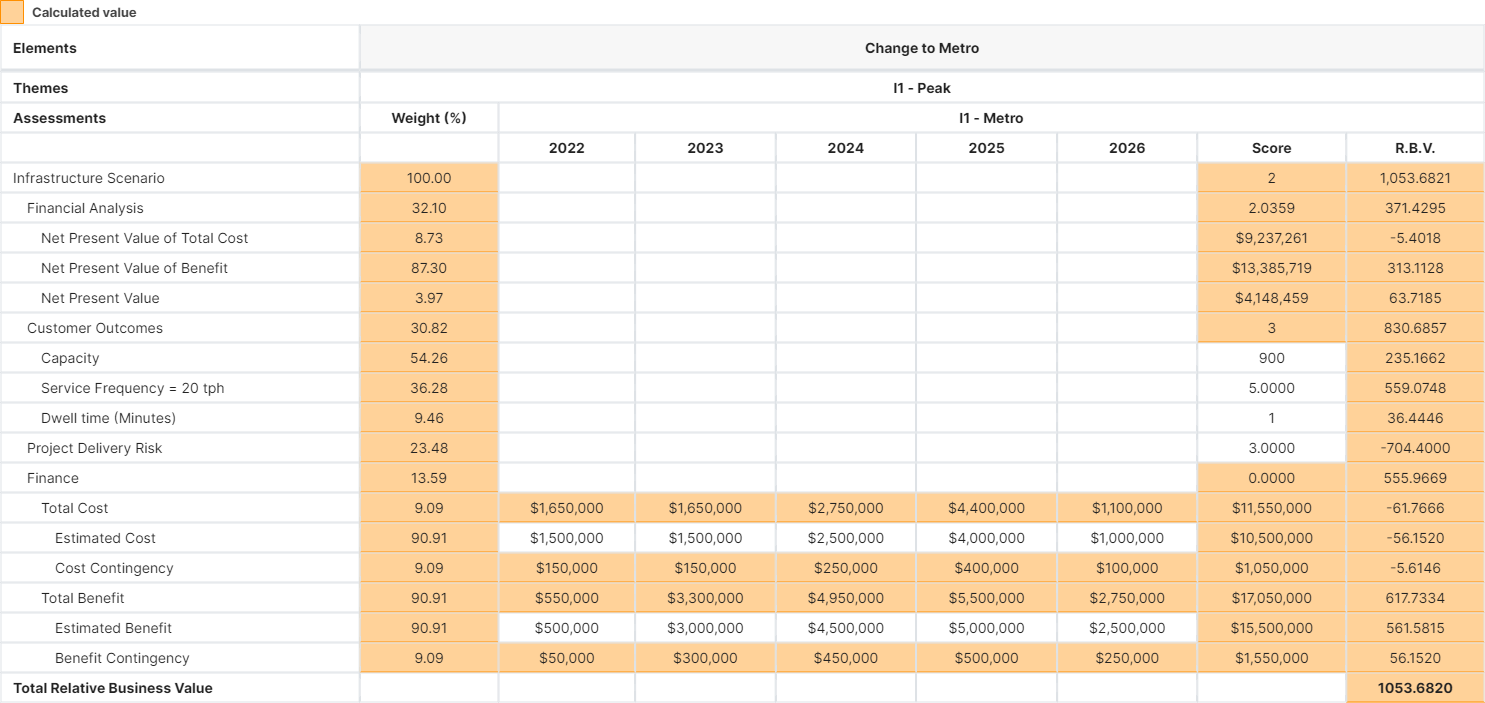
This is an overly simplified example of a cost benefit analysis being implemented within AppO. It includes intangibles, such as project delivery risk, in a railway capacity scenario.
Note that the specification of accounting periods is entirely flexible and unlimited.
Business ratios can be automatically calculated from data held in any value measure. Variables such as discount rate for Net Present Value calculations can be configured to meet corporate policy and “what if” scenarios.
Detailed Product, Service, Location, Market Analysis
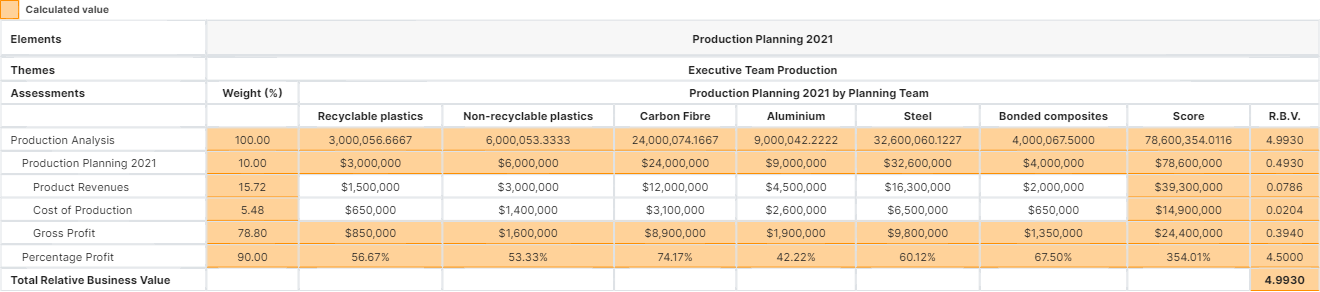
This is an example taken from a production planning scenario showing the forecast revenues by product.
In addition it is possible to analyse revenues (or anything else), for example, by a combination of product, accounting period, location, market type etc.